Financial Visualizations
Enhanced financial charts with comprehensive analysis and insights for Golden Meadows Residential (2022-2024)
Analysis
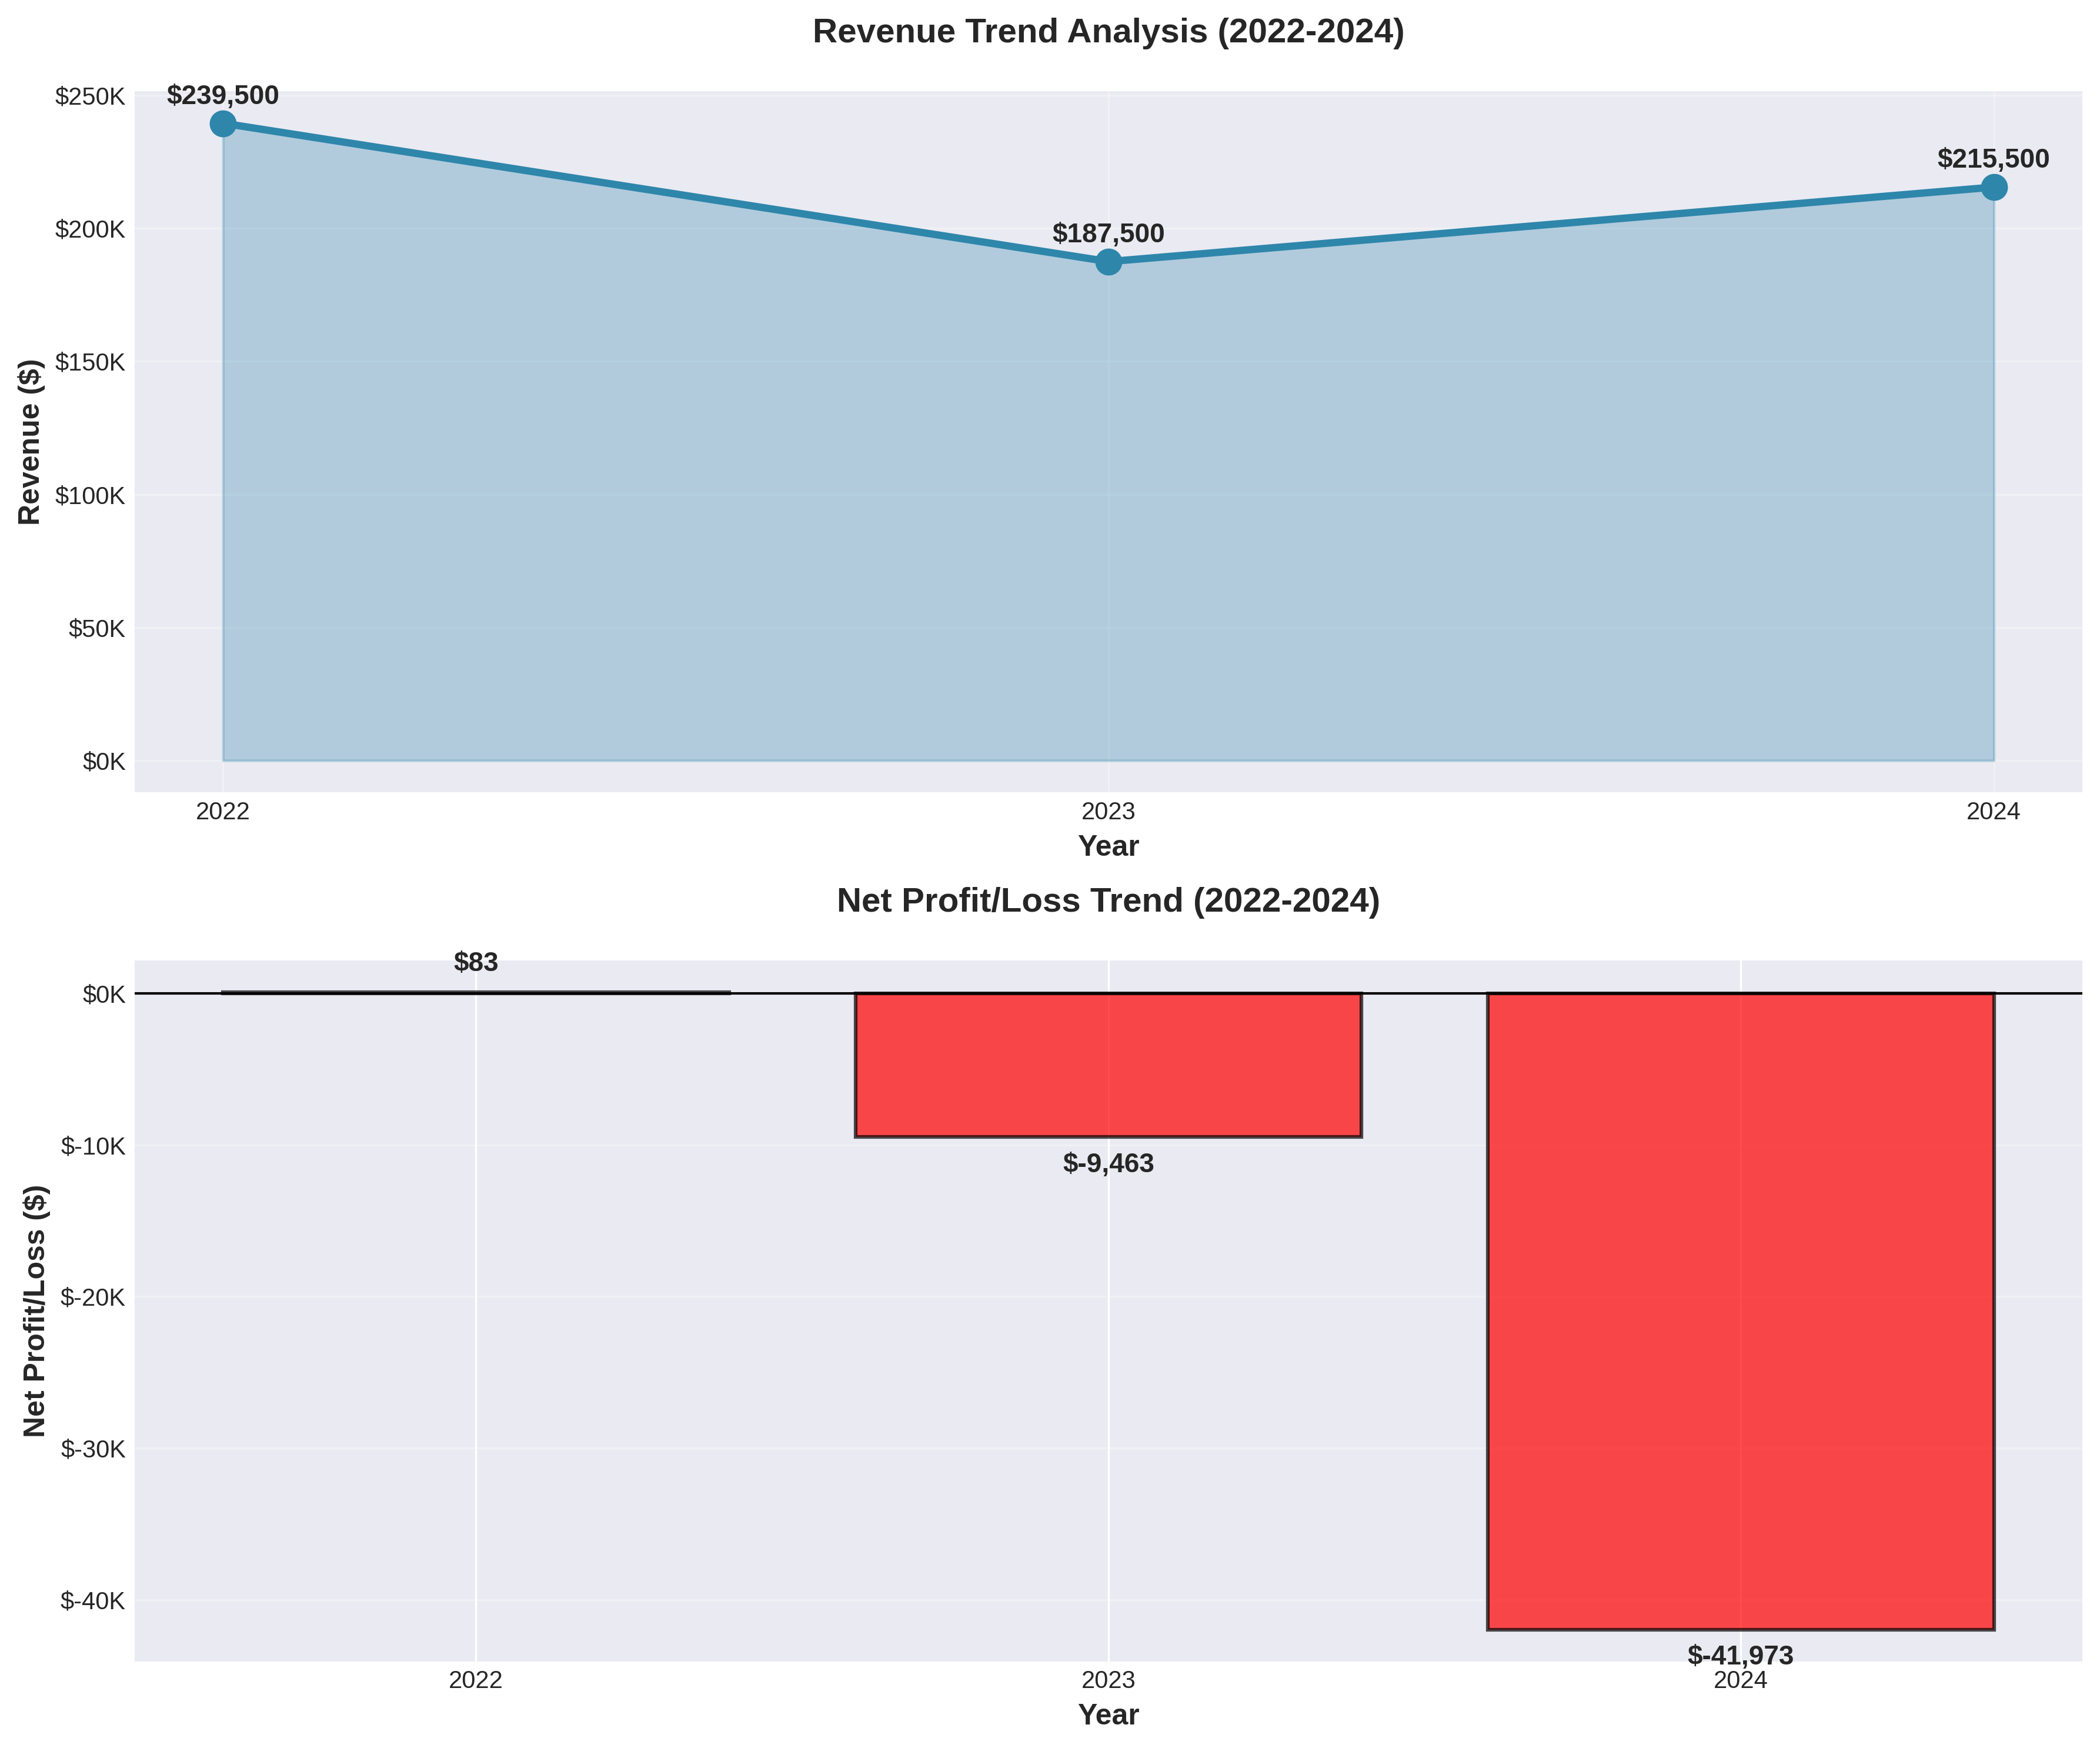
This dual-panel visualization shows the three-year trajectory of both revenue and net profit/loss. The top panel reveals revenue volatility, dropping from $239.5K in 2022 to $187.5K in 2023 before recovering to $215.5K in 2024. The bottom panel illustrates the concerning profitability decline, moving from a small profit of $83 in 2022 to significant losses of $9,463 in 2023 and $41,973 in 2024.
Key Insights
- •Revenue decreased 21.7% from 2022 to 2023
- •Partial recovery of 14.9% in 2024, but still below 2022 levels
- •Net loss increased 343.6% from 2023 to 2024
- •Profitability margin declined from 0.0% to -19.5%
Analysis
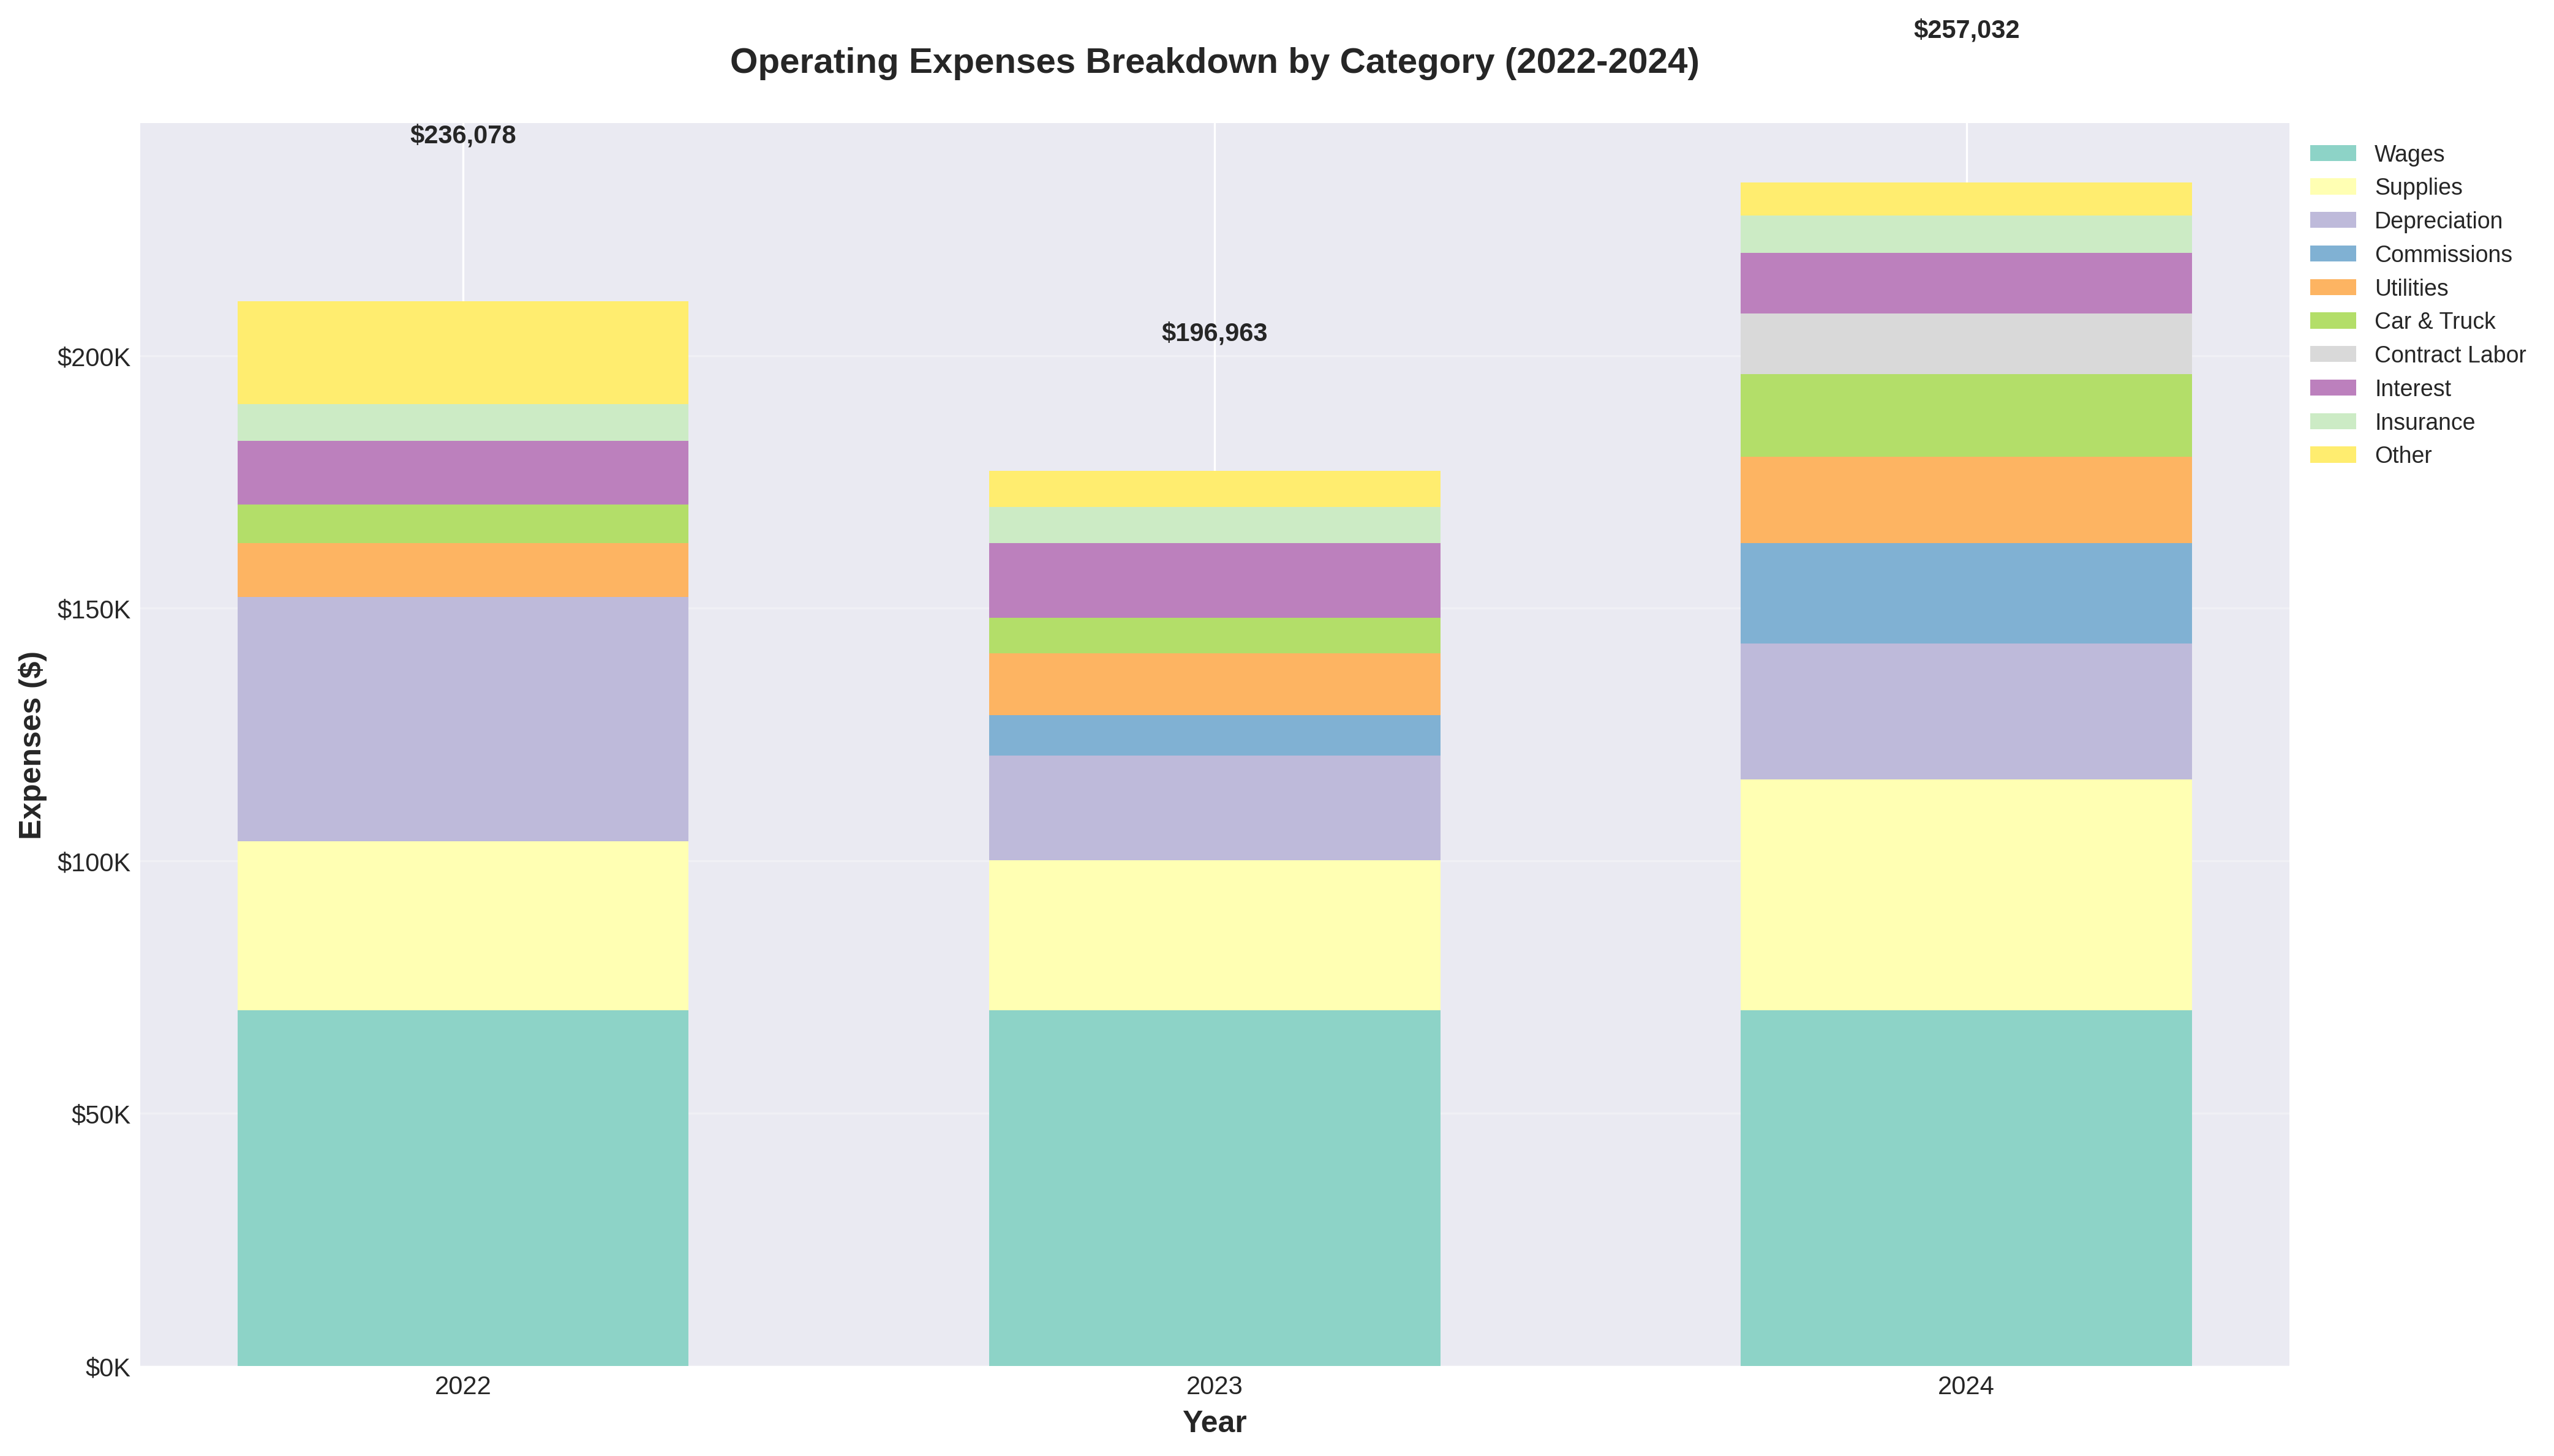
This stacked bar chart provides a comprehensive breakdown of operating expenses across all major categories for each year. It clearly shows how different expense categories have evolved, with particular attention to the dramatic increases in supplies, commissions, and contract labor in 2024.
Key Insights
- •Total operating expenses increased 30.5% from 2023 to 2024
- •Wages remain stable at $70,400 annually
- •Supplies increased from $29,745 to $45,685 (53.6% increase)
- •New contract labor expense of $12,000 appeared in 2024
Analysis
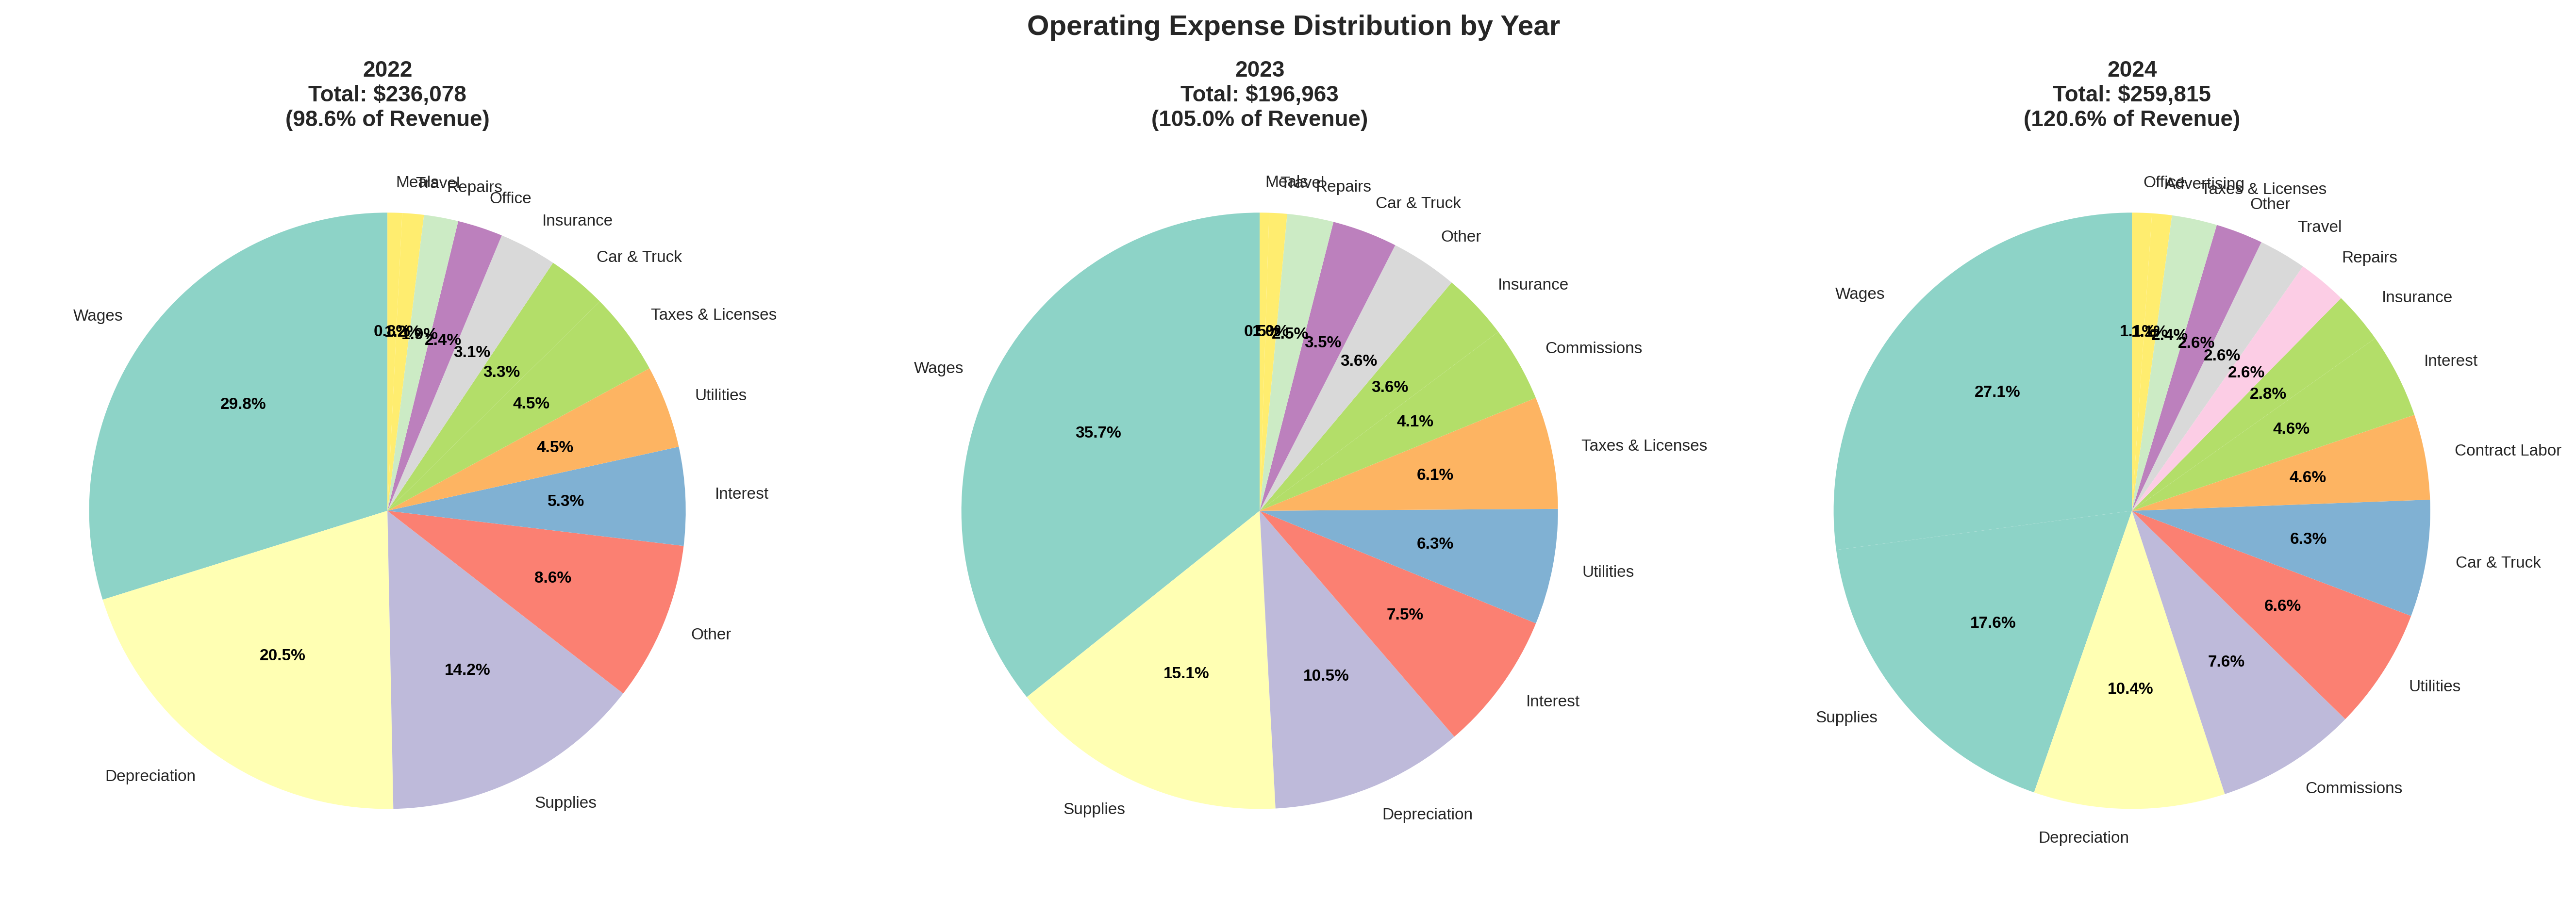
Three pie charts showing the proportional distribution of expenses for each year. This visualization makes it easy to see how the expense structure has shifted over time, with depreciation being dominant in 2022 and a more diversified expense profile emerging in 2023 and 2024.
Key Insights
- •2022: Depreciation represented 20.5% of expenses
- •2024: Expense profile more diversified
- •Wages consistently the largest category (27-32%)
- •Total expenses grew from 98.6% to 119.3% of revenue
Analysis
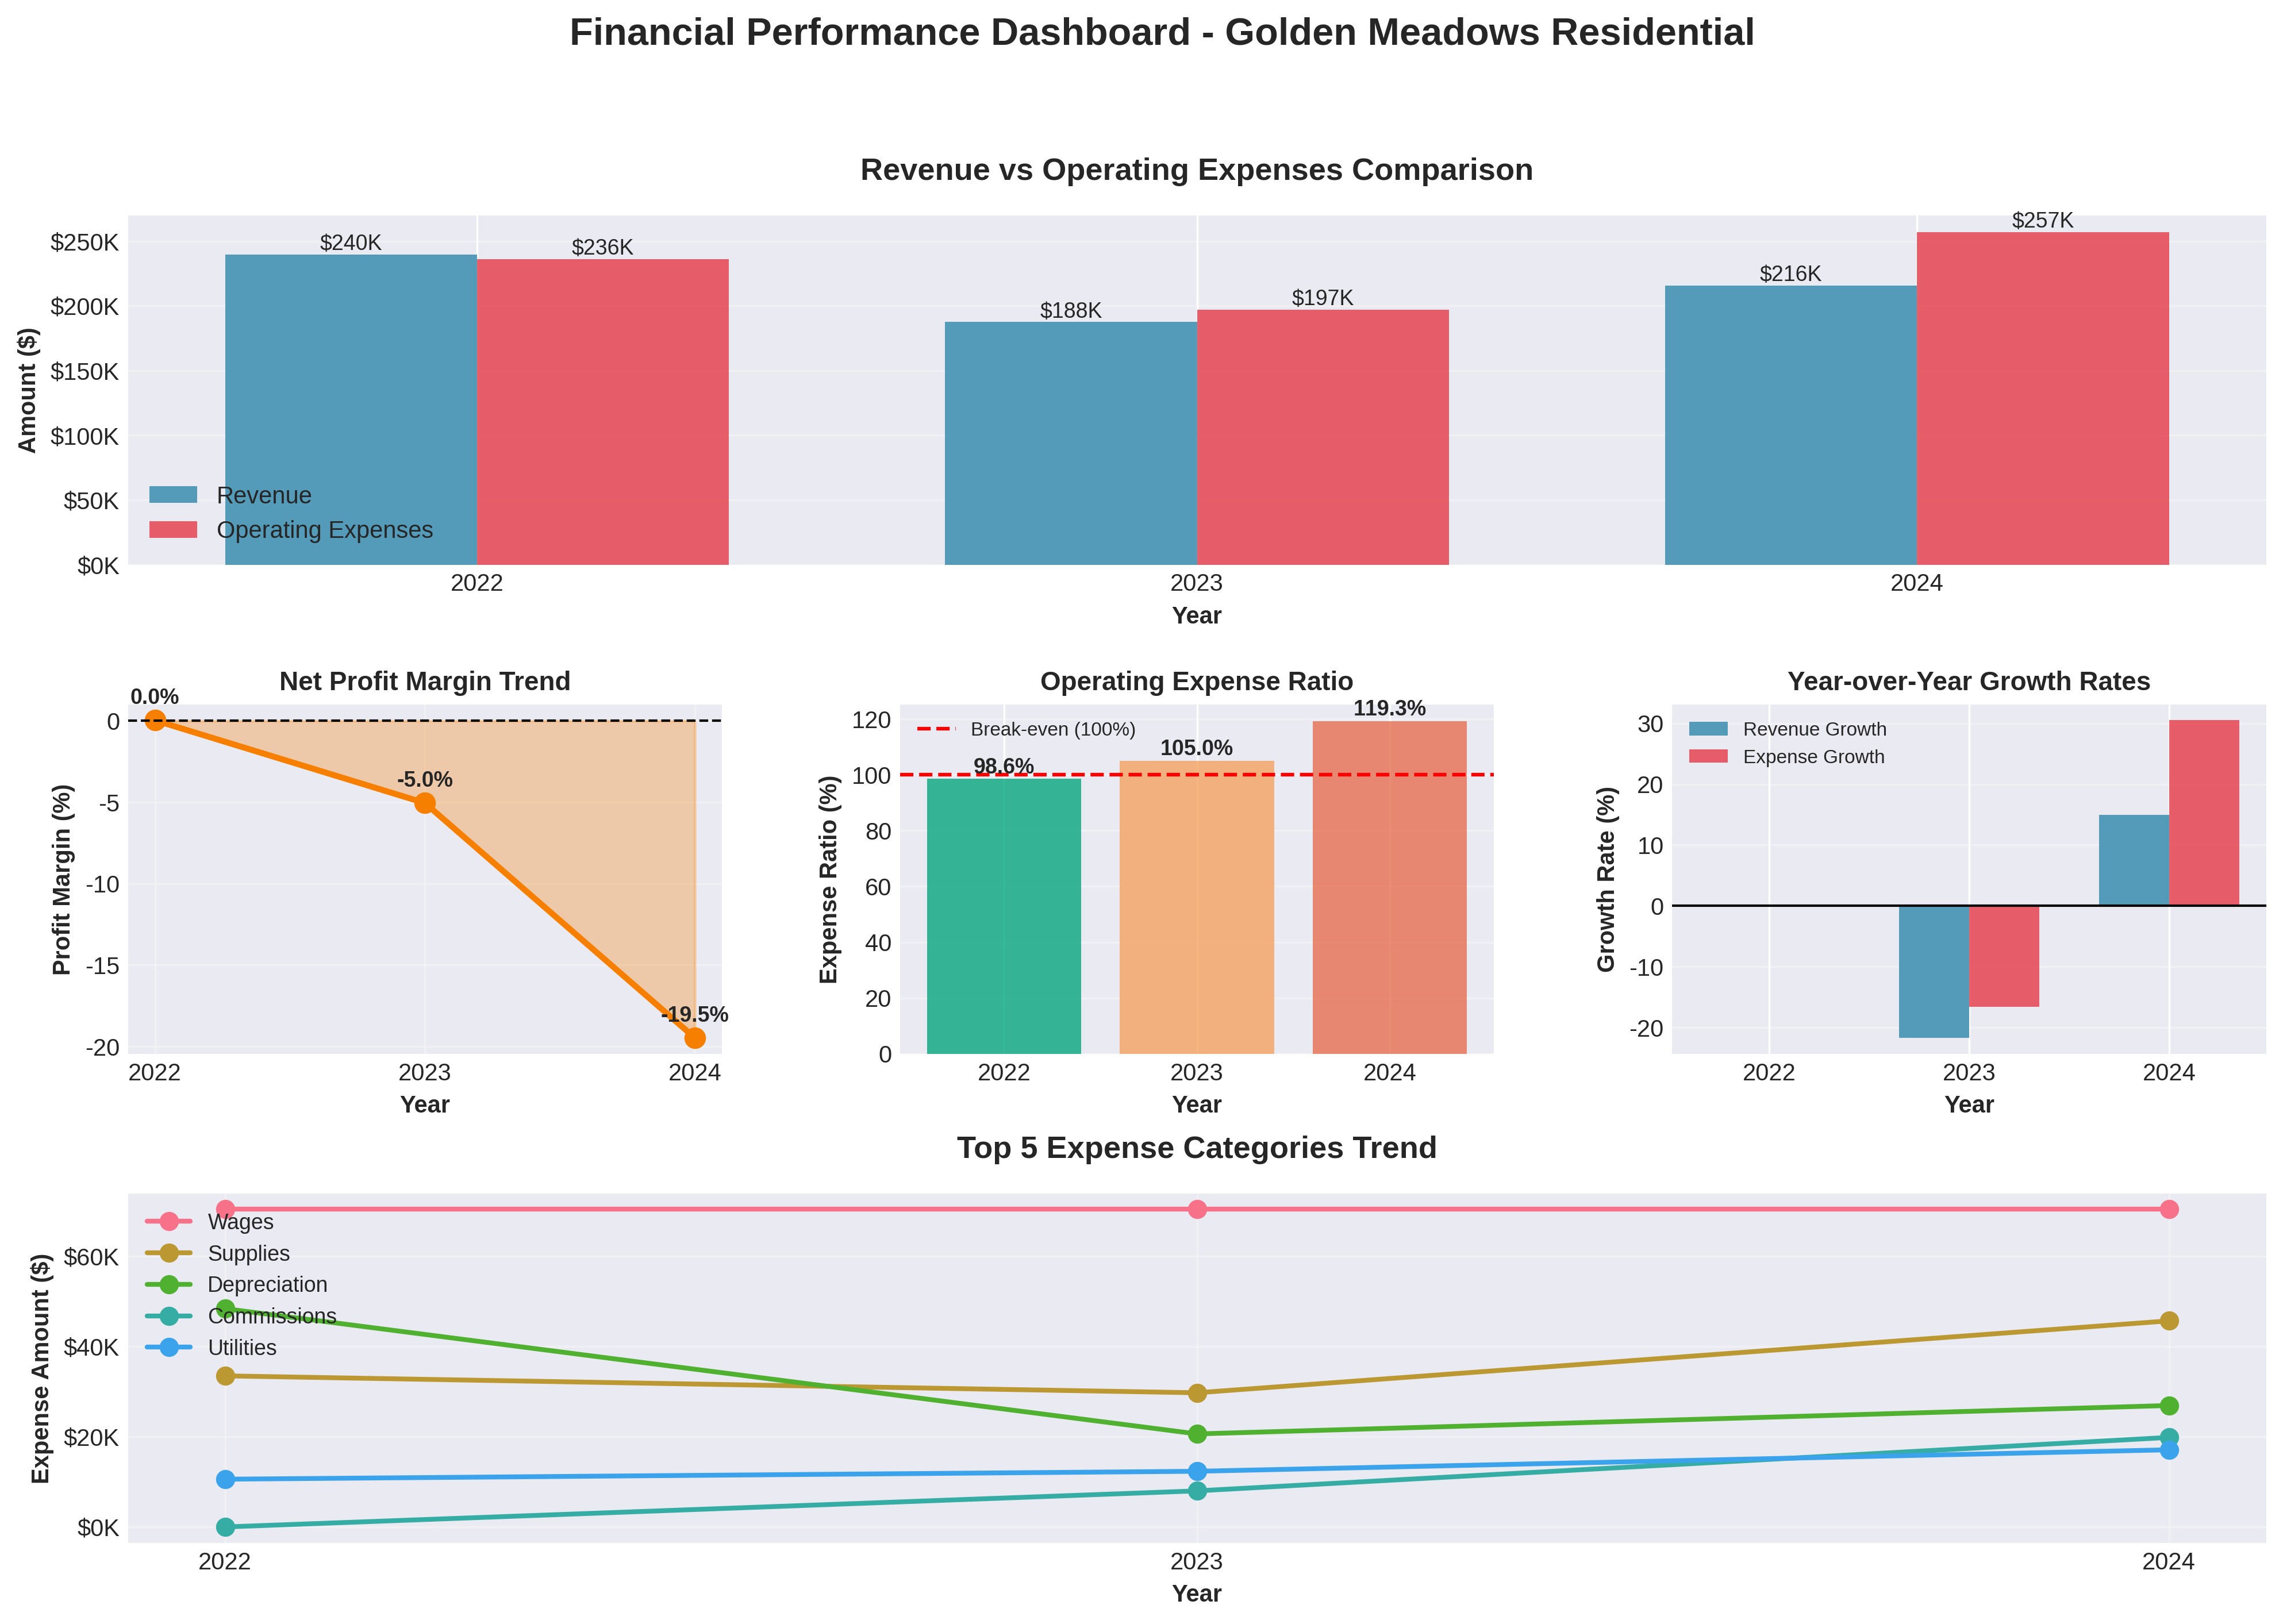
A comprehensive multi-panel dashboard displaying key performance indicators including revenue vs. expenses comparison, profit margin trends, operating expense ratios, year-over-year growth rates, and the top 5 expense categories over time. This dashboard provides a holistic view of the business's financial health.
Key Insights
- •Operating expense ratio reached 119.3% in 2024
- •Profit margin declined to -19.5%
- •Expense growth (30.5%) far exceeded revenue growth (14.9%) in 2024
- •Supplies and commissions show steepest upward trends
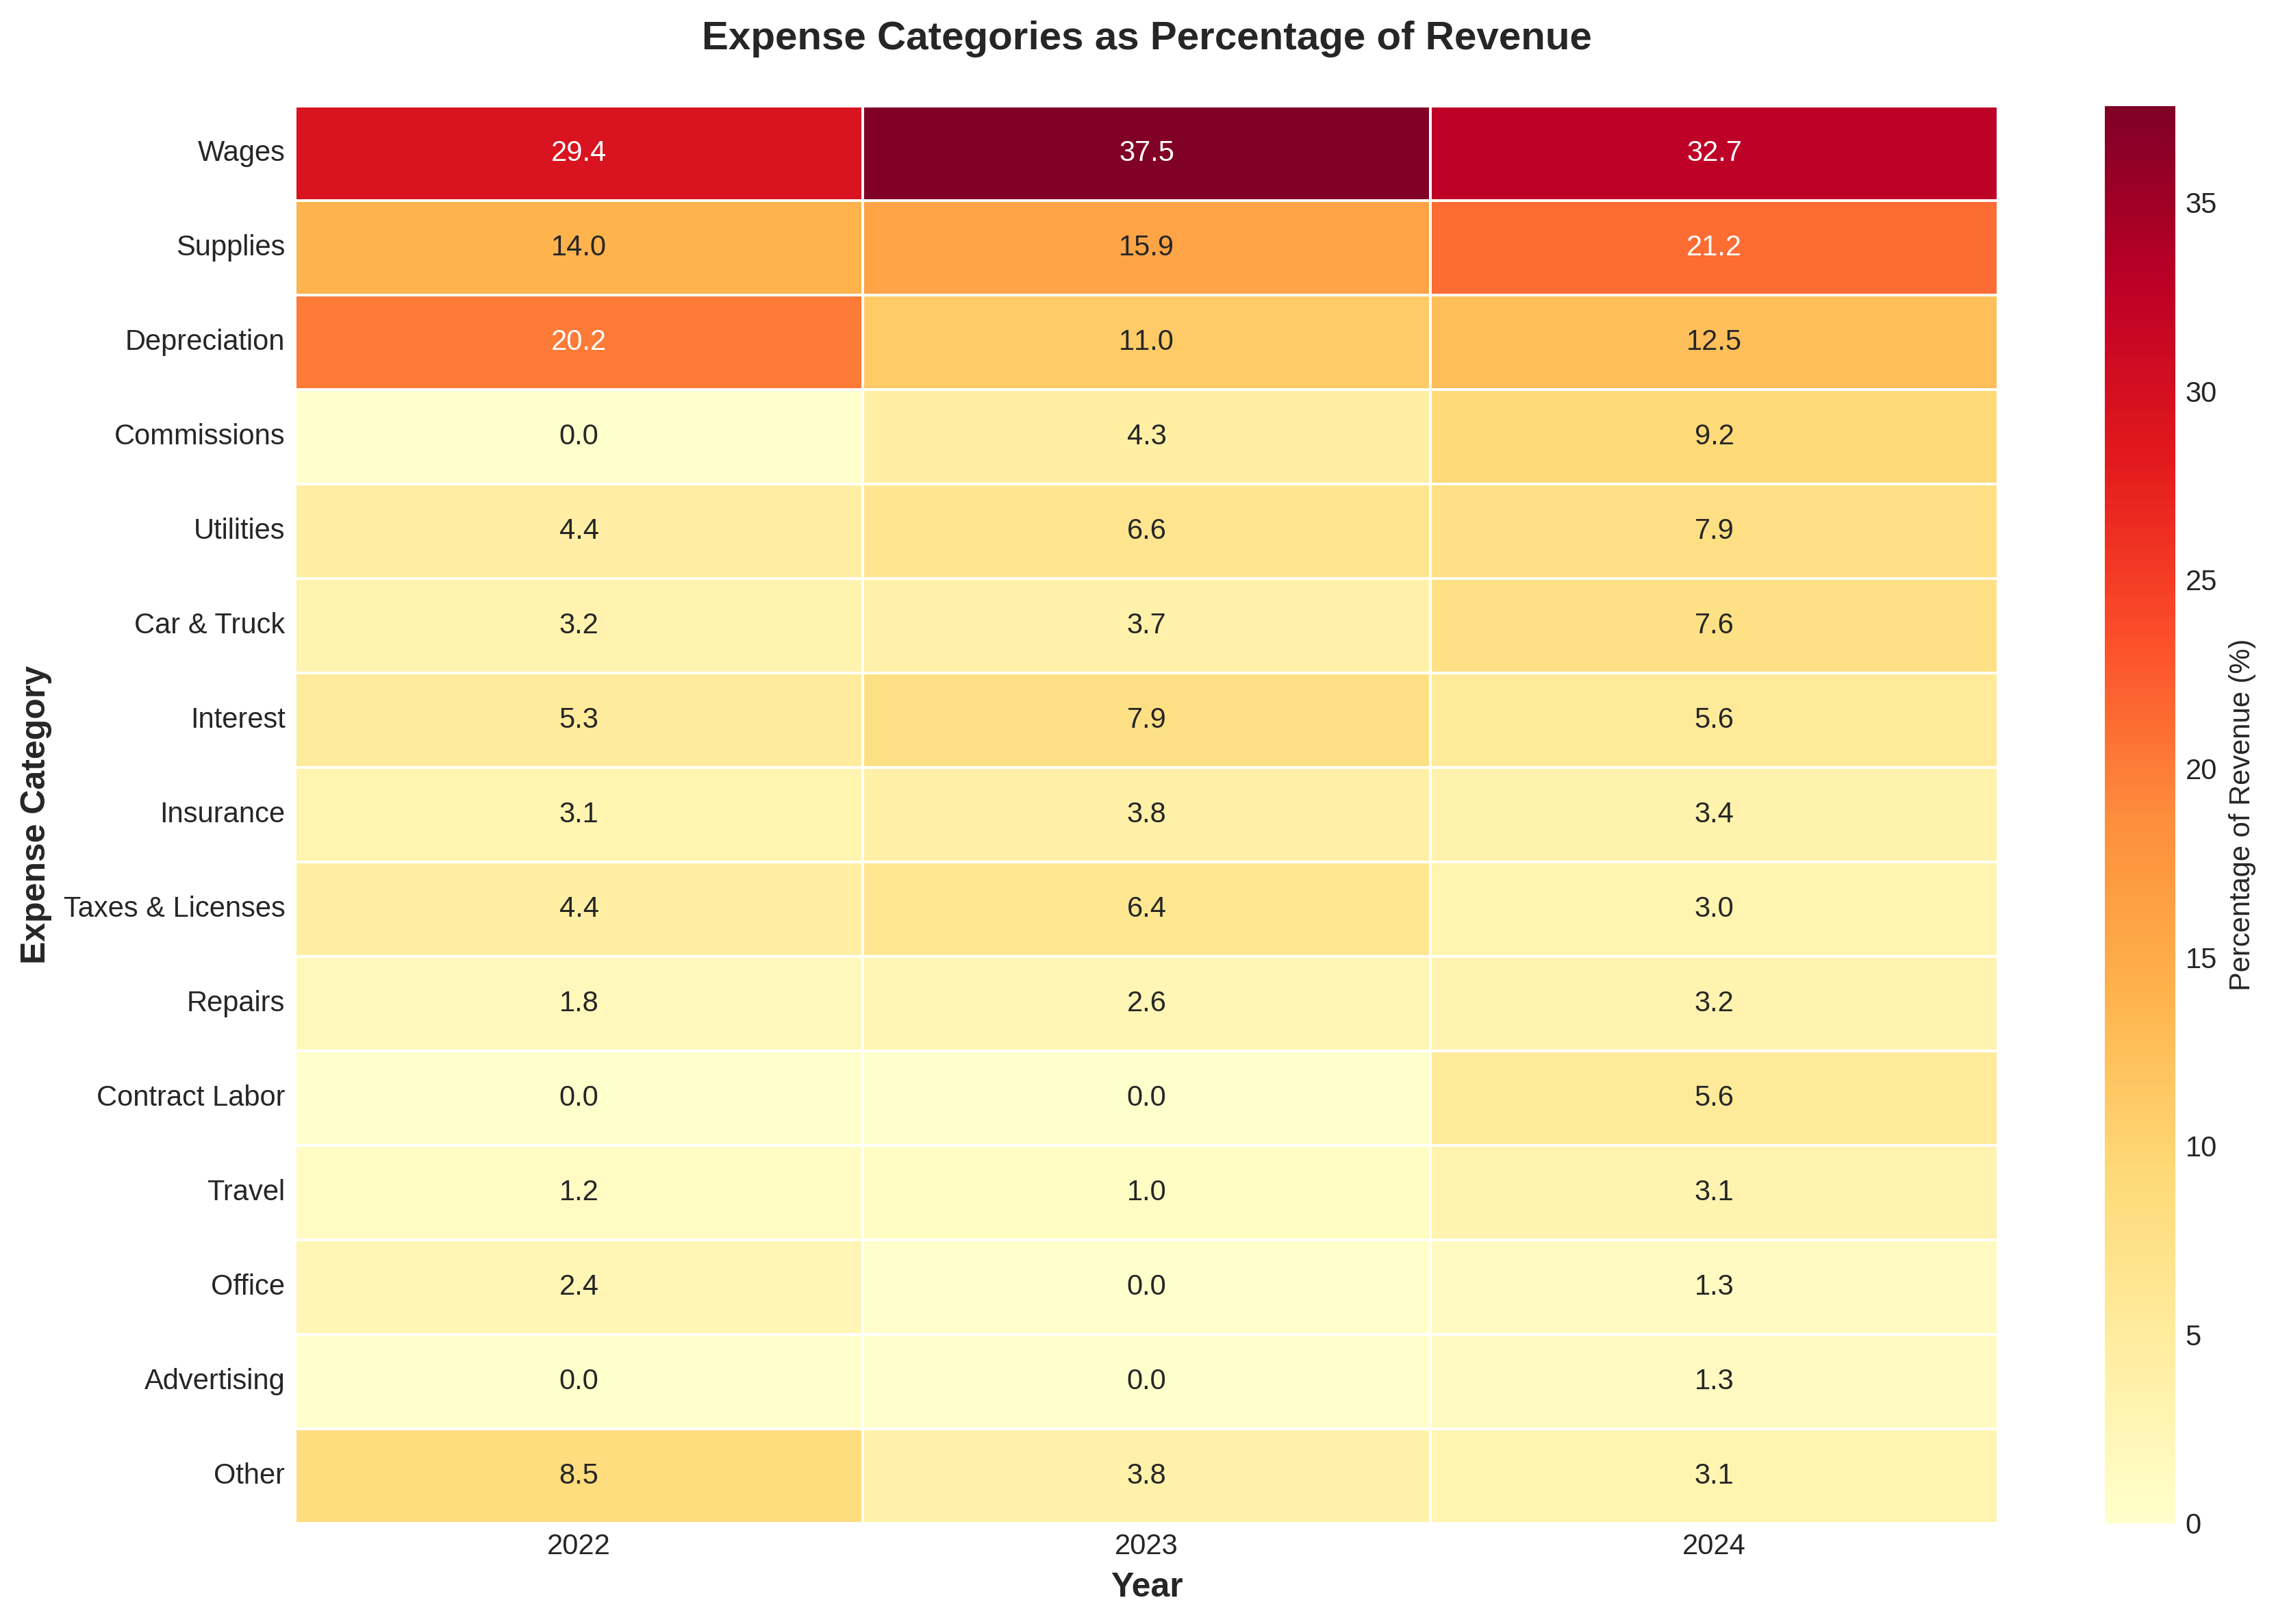
Analysis
This heatmap visualizes each expense category as a percentage of total revenue, with color intensity indicating the relative burden. Darker colors represent higher percentages, making it easy to identify which expenses are consuming the largest share of revenue and how this has changed over time.
Key Insights
- •Wages increased from 29.4% to 32.7% of revenue
- •Supplies grew from 14.0% to 21.2% of revenue
- •Depreciation decreased from 20.2% to 12.5% of revenue
- •Multiple expense categories exceed industry benchmarks
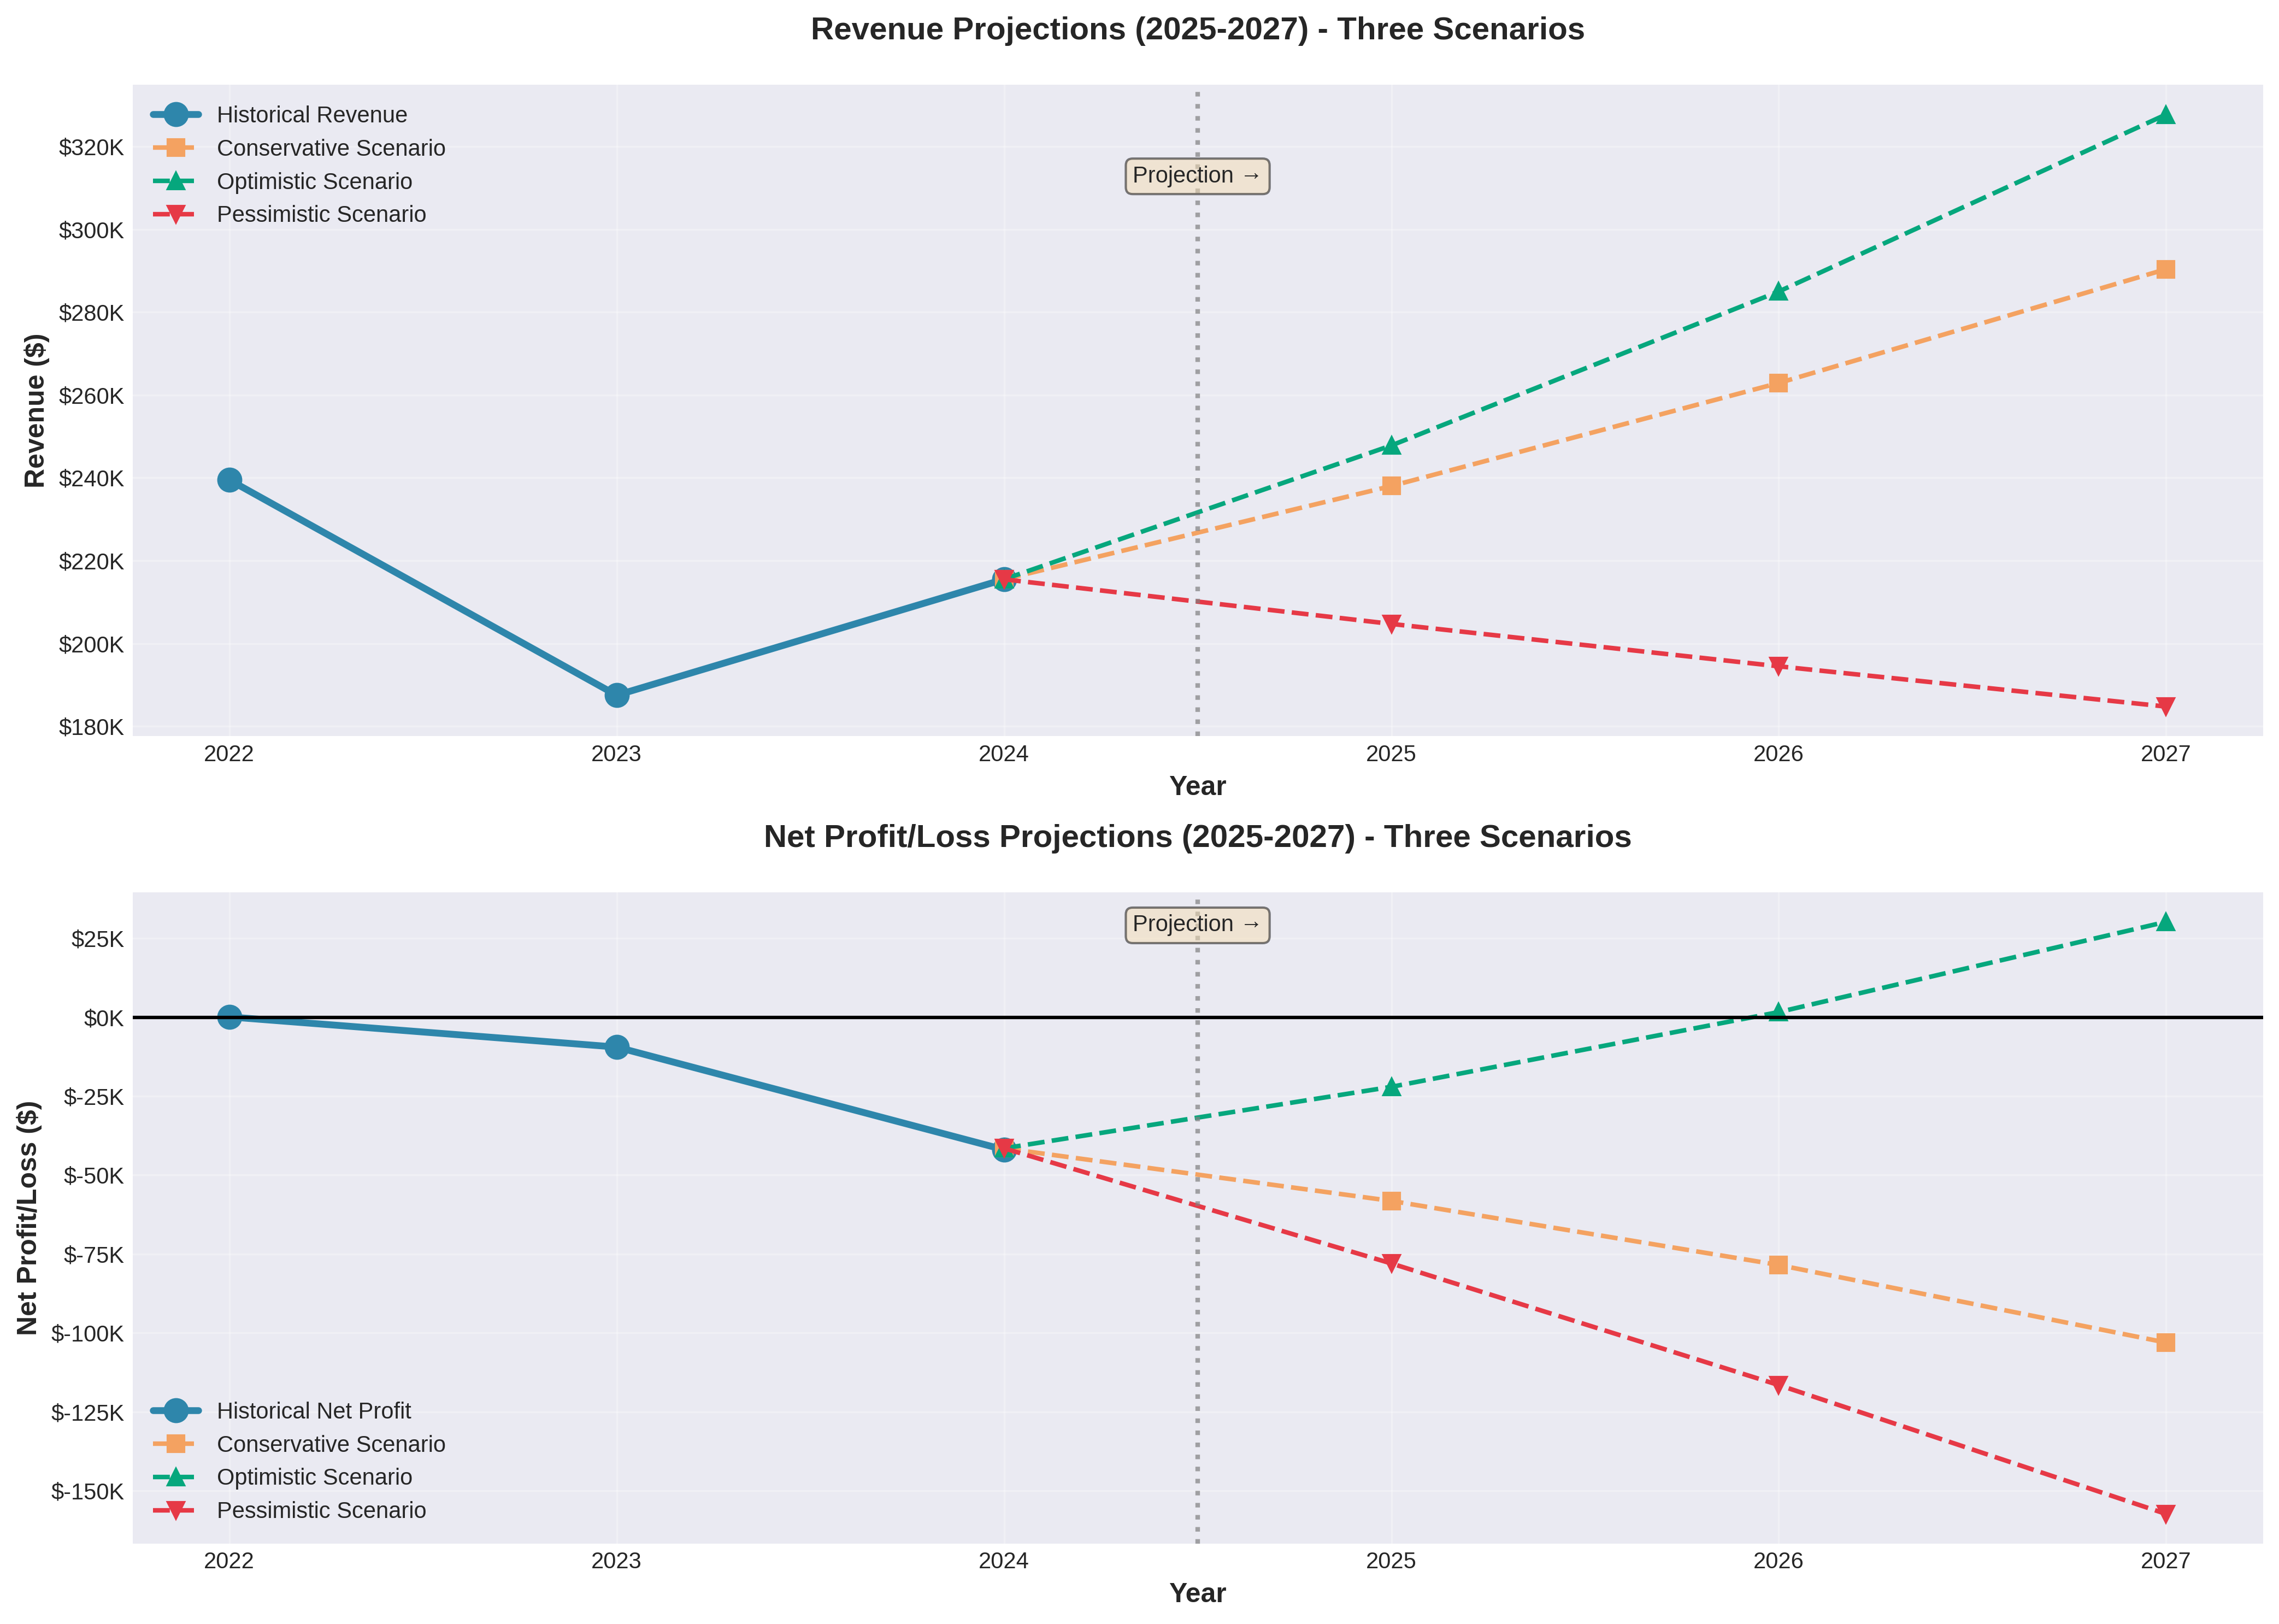
Analysis
Three-scenario financial projections showing potential future outcomes based on different assumptions. The pessimistic scenario assumes continued revenue decline and expense growth. The conservative scenario extrapolates current trends. The optimistic scenario requires aggressive revenue growth and strict cost controls to achieve profitability by 2027.
Key Insights
- •Pessimistic: Losses exceed $157K by 2027
- •Conservative: Losses reach $103K by 2027
- •Optimistic: Potential $30K profit by 2027 with 15% revenue growth + 5% expense control
- •Current trajectory is unsustainable without intervention
Challenges Identified
- ⚠Operating expenses exceed revenue by 19.3% in 2024
- ⚠Net loss increased 343.6% from 2023 to 2024
- ⚠Expense growth (30.5%) far exceeds revenue growth (14.9%)
- ⚠Current trajectory leads to losses exceeding $100K by 2027
Path to Profitability
- ✓Achieve 15% annual revenue growth
- ✓Limit expense growth to 5% annually
- ✓Focus on supplies and commission cost reduction
- ✓Potential $30K profit achievable by 2027